Final Third Efficiency Metrics Reshape Premier League Handicap Markets
Written by Katja Peters · Oct 6, 2026
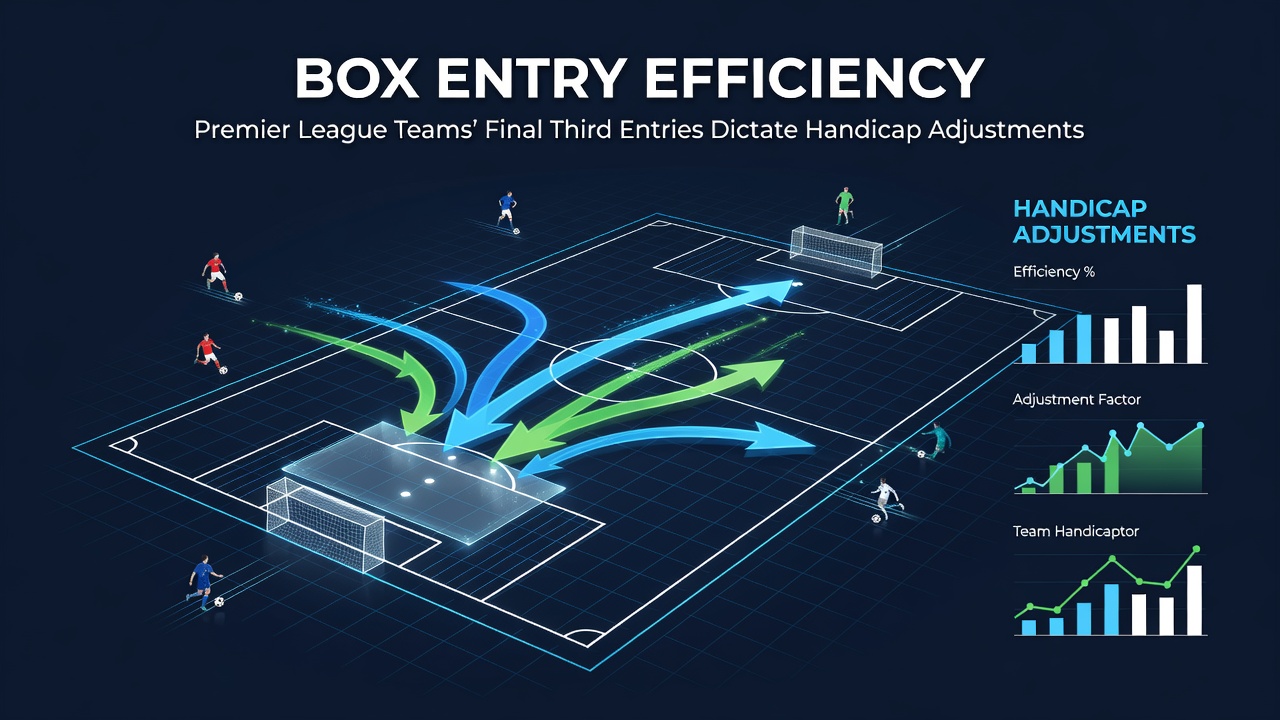
Final Third Efficiency Metrics Reshape Premier League Handicap Markets
Premier League squads generate consistent patterns through their ability to enter the final third, and these box entry figures directly inform how bookmakers calibrate Asian handicap lines each week. Teams that record higher volumes of controlled entries into the penalty area create measurable attacking pressure that markets incorporate into pre-match adjustments, while lower entry rates signal defensive priorities that shift lines toward tighter margins.
Defining Box Entry Efficiency in Match Contexts
Box entry efficiency tracks the number of times a team progresses the ball into the final third with possession intact, often measured through progressive passes, carries, and transitions that cross the halfway line threshold. Analysts compile these figures from tracking data that records every sequence leading to an entry, and squads with elite rates frequently exceed 60 successful entries per 90 minutes in the 2025-26 campaign. Such metrics separate sustained pressure from isolated long balls, because efficient entries correlate with higher shot volumes and sustained territorial dominance that betting operators monitor closely.
Researchers at institutions focused on sports performance have documented how entry quality varies by formation, and data from October 2026 shows teams employing high-pressing systems maintain elevated entry counts even against compact defenses. This consistency prompts handicap markets to widen spreads for sides averaging above-average entry success, because the underlying numbers suggest reliable goal threat rather than sporadic bursts.
Seasonal Patterns Emerging in 2026
Early rounds of the 2026-27 season have produced clear divides among mid-table and top-six contenders based on final third access rates. Clubs that prioritize wide overloads record more entries from the flanks, and those patterns have led to noticeable line movements in handicap markets during October fixtures. Defensive blocks that limit entries to under 45 per match appear in lower table positions, and operators respond by tightening away handicap values for those sides when they travel.

One study from an Australian sports analytics center revealed that entry efficiency predicts goal differentials more reliably than raw possession percentages, and this finding has influenced how several European betting platforms structure their Premier League offerings. Teams that convert entries into shots at rates above 35 percent see their handicap lines adjusted upward in home fixtures, while lower conversion sides receive more conservative treatment that reflects their limited penetration.
Handicap Adjustments Driven by Entry Data
Bookmakers integrate entry statistics into models that recalibrate lines after each matchweek, and October 2026 data illustrates several instances where elevated entry counts forced market corrections. A side averaging 68 final third entries per game entered a fixture with a minus 0.75 handicap that later moved to minus 1.0 after entry trends became public, because the volume indicated sustained superiority against comparable opponents. Conversely, squads that struggle to breach compact defenses see lines compressed, since fewer entries reduce the probability of covering larger spreads.
Industry reports from Canadian gaming associations confirm that entry-based models have gained traction among professional bettors who track weekly updates, and these adjustments create opportunities when public perception lags behind the underlying metrics. Midweek schedule congestion often depresses entry rates for rotated squads, which in turn prompts temporary softening of handicap lines until fresh data arrives.
Case Examples From Recent Fixtures
Take one October 2026 encounter where a promoted side recorded just 38 final third entries against a top-half opponent, and the handicap opened at plus 1.5 before closing at plus 1.25 once entry figures circulated among sharp markets. The limited penetration aligned with a low-scoring outcome, and operators had already priced the efficiency gap into their calculations. Another match featured a title contender that posted 72 entries, resulting in a line shift from minus 1.25 to minus 1.5 as the week progressed, because repeated access to dangerous areas demonstrated repeatable threat.
Those who've examined similar sequences note that entry location matters as much as volume, since central entries produce higher expected goals than wide ones and trigger more aggressive handicap responses. Data compiled through the first eight weeks of the season shows central entry rates above 40 percent of total entries correlate with stronger handicap cover rates for favored teams.
Conclusion
Premier League final third entry statistics continue to shape handicap frameworks as operators refine their models with each round of fixtures. Teams that sustain high entry efficiency maintain consistent pressure that markets translate into adjusted lines, while lower rates prompt more cautious spreads that reflect limited penetration. Observers tracking these metrics through October 2026 and beyond will find the numbers provide measurable context for how lines evolve across the campaign.